

Today, the EO4SD Climate Resilience Cluster releases the Rainfall Explorer, a cutting-edge tool that enables users to readily obtain near real-time extreme rainfall statistics for past major flood events recorded anywhere in the world.
Global annual dollar damages from floods have increased from an average of US $4bn in 1971 to around US $40bn by 2015. Despite increasing flood-related losses, there remains low capacity to understand historic flood - rainfall patterns, trends, and impacts, across most of the world. These gaps in understanding compound uncertainties about how extreme rainfall and flood hazard could change under a future climate.
All of this increases the imperative to leverage new and existing data to derive deeper insights that may improve early-warning of near-term flood risks and inform development of robust, climate resilient strategies to deal with future flood risk. Our tool, which is already used by the World Bank and Multilateral Investment Guarantee Agency, seeks to be part of the solution.
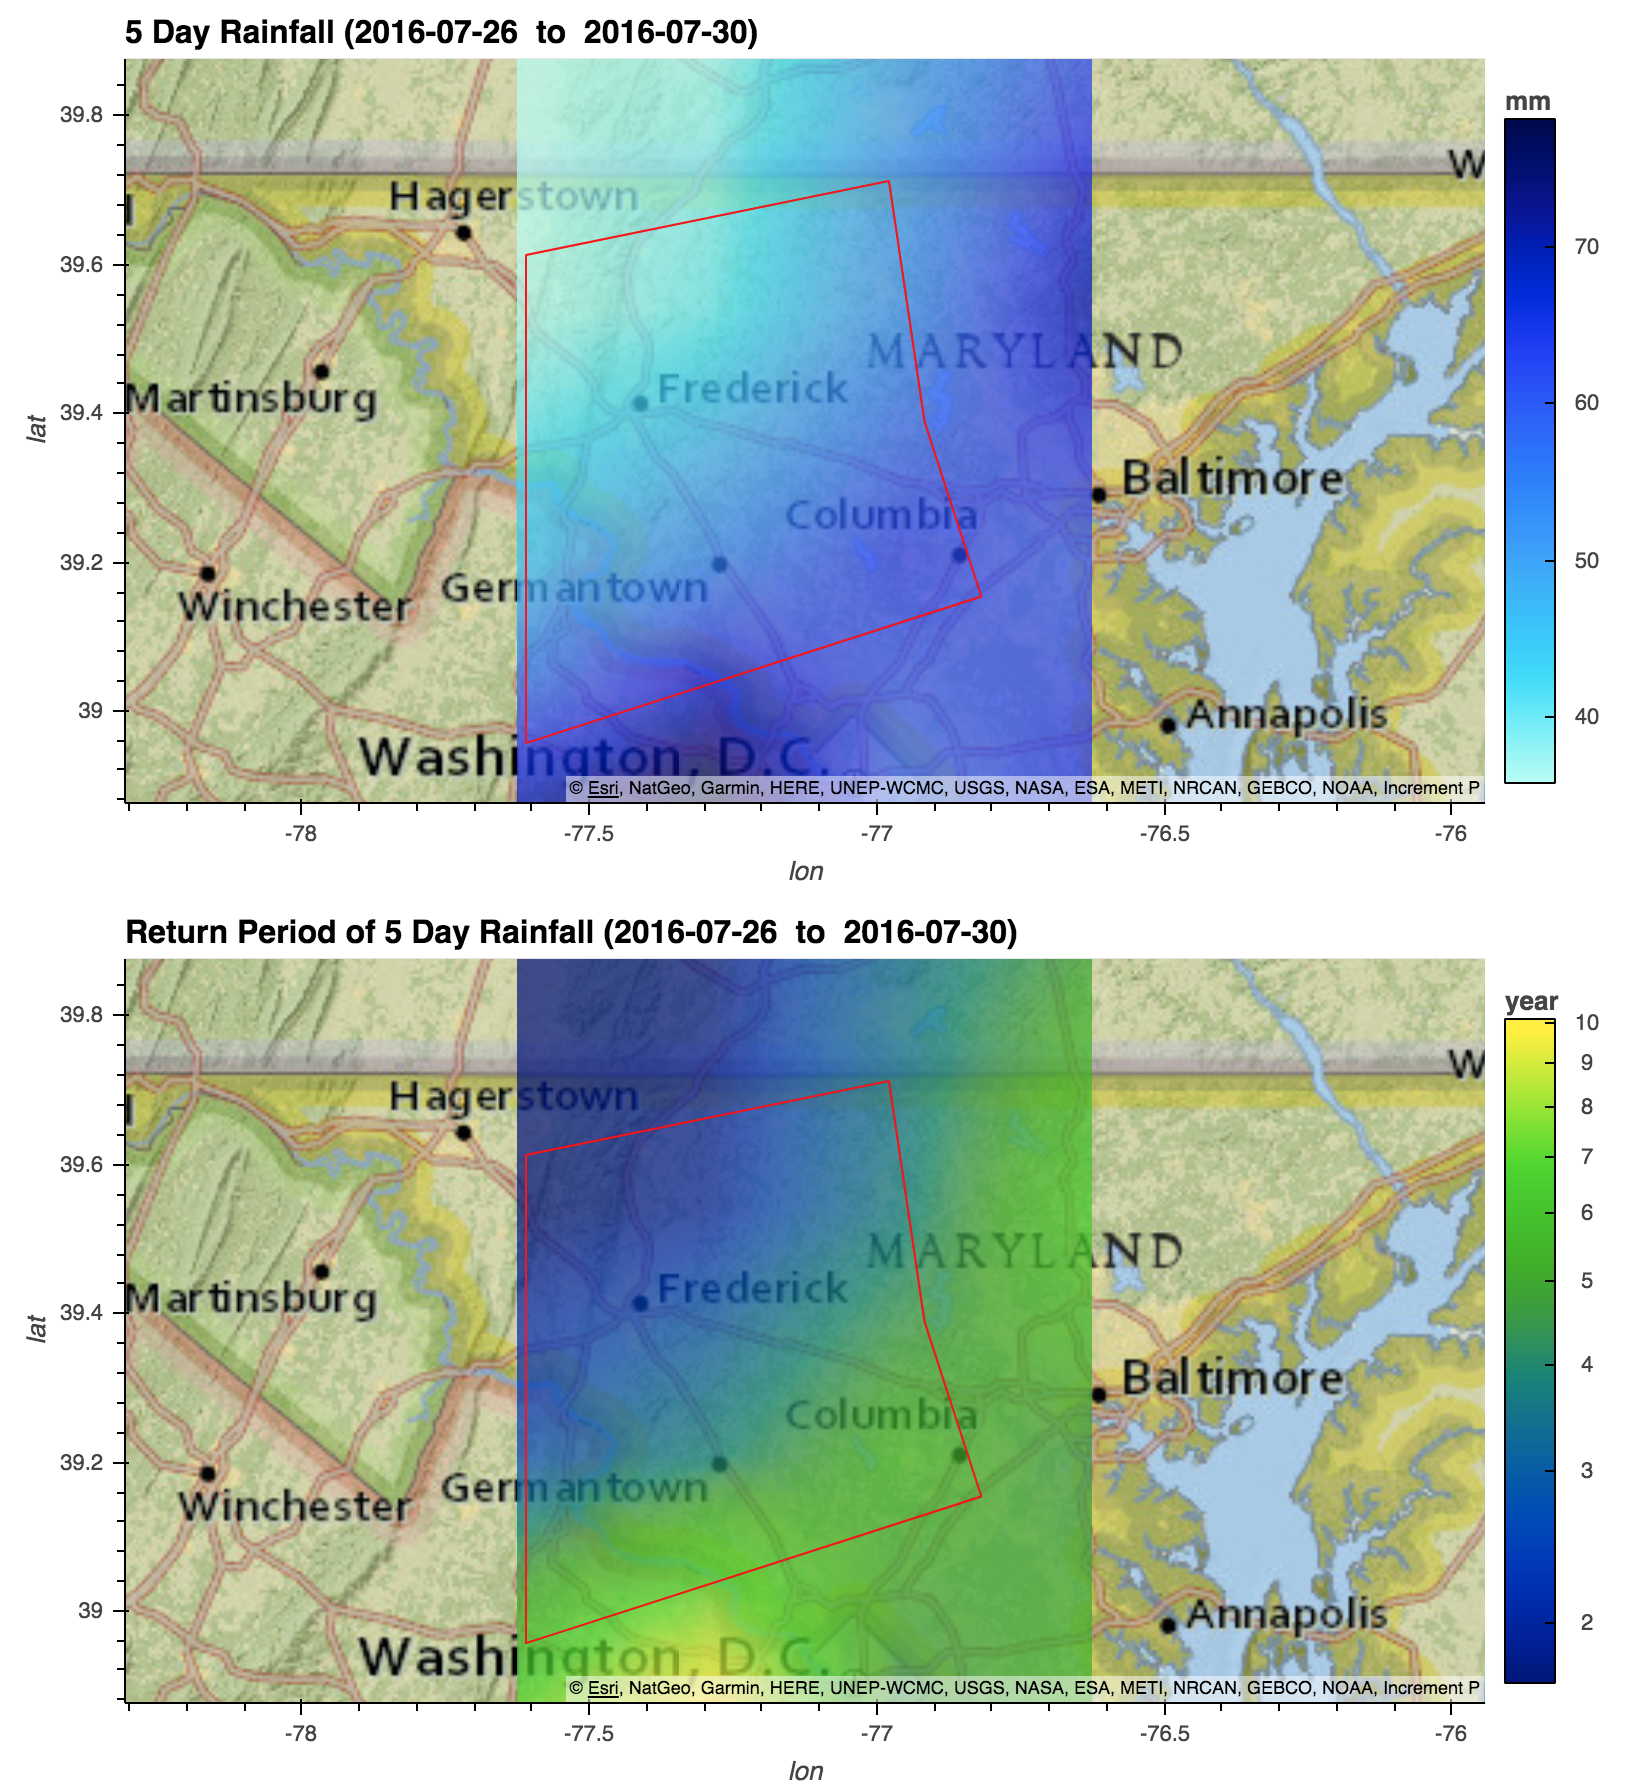
Rainfall return level and return period data during late July 2016 over Maryland (USA) visualised using the Rainfall Explorer.
It is well understood that prolonged heavy rainfall is a key trigger of major flood events globally. However, catchment characteristics, land cover, topography, drainage, flood control, and other factors (including how these change in these over time) result that flood propensity for similar amounts of rainfall varies significantly from place-to-place. Further, a range of factors lead an area to be flood-prone at a given point in time, including the height the water table, ground saturation, and river discharge. And whilst the Rainfall Explorer presents rainfall statistics over a 5-day period, destructive flash floods may be triggered by intensive rainfall falling in a few hours.
Nevertheless, analysing accumulated rainfall in the lead-up major floods in an area can help to illuminate the relationship between rainfall and flood propensity. Using this tool, users may select past floods or areas of interest to obtain rainfall statistics, including the amount of rainfall (mm) recorded 5-days prior to a flood, the return period (years) of this rainfall, and the range of the rainfall return period for the selected area or flood.
- In turn, these statistics can assist users to:
- Identify patterns and trends in flood occurrence, flood severity and rainfall totals, and rainfall return levels
- Identify rainfall thresholds likely to trigger a large flood in an area of interest
- Identify the amount of rainfall associated with a past material flood event of interest
- Understand the likelihood of rainfall associated with past flood events
- Find the return period (years) for a given 5-day rainfall amount (mm)
- Find the 5-day rainfall return level (mm) for a given return period (years)
- Map the region affected by a past flood event, together with the 5-day rainfall amount and return period associated with the event
The Rainfall Explorer currently leverages the Dartmouth Flood Observatory archive of large flood events (1984 to 2020) and a 40-year timeseries of processed Copernicus ERA5 Reanalysis daily precipitation data, at 30km x 30km spatial resolution, available near-real time (with 5 days delay from present time). ERA5-Land Reanalysis daily precipitation data, at enhanced 9km x 9km spatial resolution, will be available in early 2021. All data are stored and computed in the cloud, meaning that users may access the Rainfall Explorer using only a web browser, wherever they are.
The Rainfall Explorer is an EO4SD tool led by Telespazio Vega UK and Sistema GmbH, with the support of Acclimatise and GMV. We thank the World Bank and MIGA for valuable feedback provided during the development of this tool.
Access the Rainfall Explorer here.